Author: Patti Casaleggio, Invictus Analytics
As regulatory scrutiny and expectations around commercial real estate (CRE) continue to evolve, staying ahead of supervisory trends has never been more critical for community and...
The Federal Reserve’s actions over the past several weeks have dramatically reduced overall interest rates. This rate collapse makes it clear that loans maturing or resetting over the medium horizon will do so at much lower rates. Businesses and consumers have clearly opted to take advantage of the lower borrowing rates by refinancing mortgages and modifying existing credit facilities.
With so many different structures available in the market, the traditional way of categorizing a loan as either fixed or variable rate is somewhat archaic. Fixed rate loans coming due or short duration fixed rate loans behave more like variable rate loans (quasi-variable, if you will). Similarly, variable rate loans with resets that extend beyond your forecast horizon period or variable rate loans that are at their floor rates act like fixed rate loans (quasi-fixed).
Looking at how your Net Interest Margin (NIM) will behave means being granular in your ability to understand the rate reset on variable and quasi-variable loans together with the impact on growth through new underwritings. This is nothing new to a CEO, but the slight change in perception away from straight fixed or variable might help the rest of the team better understand the bank’s overall interest rate risk.
Pricing of loans has traditionally been done as a credit spread to a benchmark. A frequently used benchmark is a U.S. Treasury security of comparable maturity to the loan, under the assumption that the credit spread compensates the bank for the incremental risk. In the last 35 years, this has worked out well. Why? As the graph below shows, rates have been on a relatively steady decline over that period.
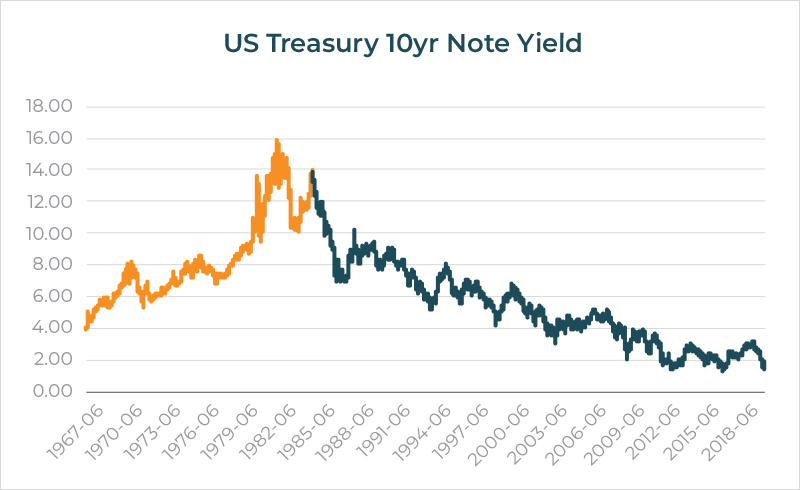
A second reason is that the yield curve (the slope between U.S. Treasury 5-year yields and 10-year yields) has been positive approximately 65 percent of the time and flat (within 25 basis points of each other) about 34 percent of the time. A negatively sloped yield curve has only happened in less than 1 percent of the more than 9,000 daily observations.
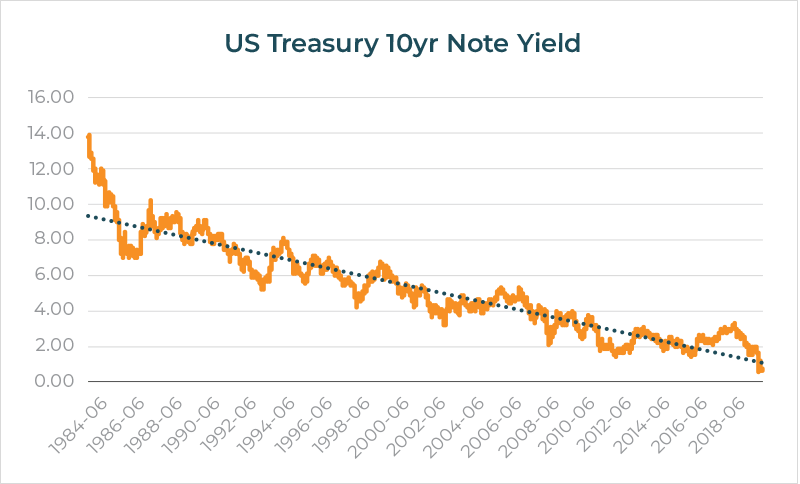
| Board of Governors of the Federal Reserve System (US), 10-Year Treasury Constant Maturity Rate [DGS10], retrieved from FRED, Federal Reserve Bank of St. Louis; https://fred.stlouisfed.org/series/DGS10, May 21, 2020 |
However, when rates were structurally rising from 1967 to 1984, the slope of the curve was positive about 25 percent of the time and negative 13 percent of the time.
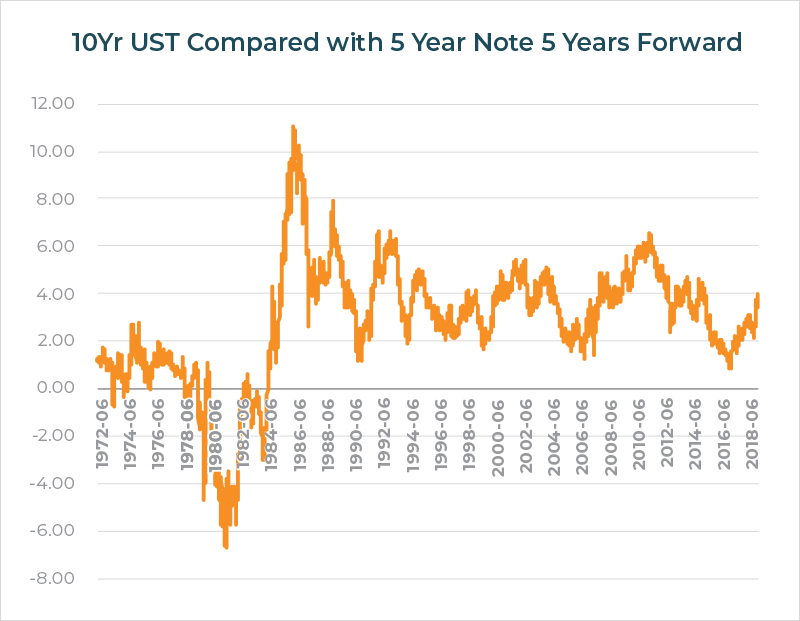
If a bank had priced a loan at 10-year Treasury + 200 basis points, then by the time it “rolled down the curve” to a 5-year maturity, the loan would have looked good relative to the current 5-Year Treasury over the last 35 years. However, before that it wouldn’t have looked as good. See the accompanying graph comparing Treasury 10-Year +200 basis points 5 years forward with the then-spot 5-Year note rate. If the loan were match funded for the full term, then it wouldn’t be as much of a problem. But let’s face it: It’s not. So why is all this history important?
All bankers know that the Federal Reserve Bank has enormous influence over short term rates. By flooding the market with overnight liquidity, either through standard open market operations, changing the borrowing rate/discount rate, or through special programs, the Fed moves the market. But since the 2008 great recession something else has also happened: The Fed entered the role of managing the long end of the yield curve.
Historically, the longer end of the Treasury maturity spectrum was deemed to be the spot predictor of forward inflation and thus forward interest rates. The markets reacted to various economic data, news, rumors, war, risk, natural events, etc.—but each of those elements contributed to a common body of perception about inflation and interest rates. When combined with the fact that the Treasury market is backed by the US government and is multiples of size over any other debt or equity market, it presented itself as valid risk-free rate.
Now that the Fed has entered as a major participant via multiple quantitative easings, the question one must ask is this: Does the longer end of the Treasury yield curve actually represent the true risk-free rate? Or should the risk-free rate, given the enormous supply flooding the market, be substantially higher? And then the corollary question is: if the risk-free rate is now a manipulated rate, is credit pricing as a spread off of a manipulated benchmark a valid way to assess the price of an inherent risk in a credit? Rates do not have much further to go down (unless they go negative, which is certainly possible)—so eventually they will rise. And what “the Fed giveth the Fed taketh away” when it unwinds its latest round of quantitative easing. This could put banks in a difficult position as fixed-rate loans priced in a flat yield curve with declining or steady rates roll down the maturity curve in a rising rate environment. It could put those halfway matured loans at yields that are substantially less than corresponding Treasuries!
Let’s add one more element to the benchmark question. Several years ago the major banks, after “prompting” from regulators, moved away from Libor and substituted what is deemed to be a much more reflective market rate called Secured Overnight Financing Rate (SOFR). Currently there are literally trillions of dollars and derivatives priced on Libor as a benchmark. Eventually the loans and derivatives will mature, and SOFR and its derivatives are supposed to replace Libor. But let’s just take a quick look at SOFR compared to 3-month Libor (the most frequently used Libor rate for loans).
As can be seen from the accompanying graph, SOFR tracks 3-month Libor (almost). And it’s the “almost” that’s a problem. The graph shows the spike in the overnight rate during September when there was a market liquidity crunch. Because SOFR is an overnight rate, it generally will be lower than 3-month Libor—and SOFR is considered a “risk free” rate since it is collateralized by US Treasuries. On the other hand, Libor has inherent bank credit risk. The comparison with overnight Libor might show a little more tracking accuracy but most banks use 3-month Libor as the reference rate or benchmark.
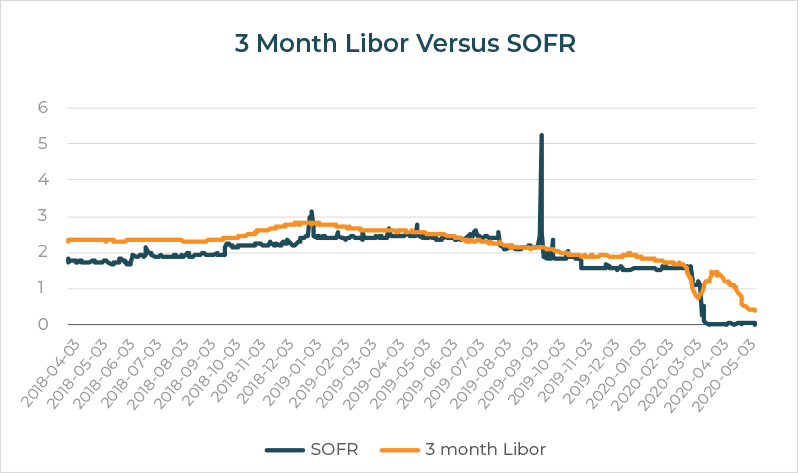
| ICE Benchmark Administration Limited (IBA), 3-Month London Interbank Offered Rate (LIBOR), based on U.S. Dollar [USD3MTD156N], retrieved from FRED, Federal Reserve Bank of St. Louis; https://fred.stlouisfed.org/series/USD3MTD156N,Federal Reserve Bank of New York, Secured Overnight Financing Rate [SOFR], retrieved from FRED, Federal Reserve Bank of St. Louis; https://fred.stlouisfed.org/series/SOFR, May 24, 2020.May 24, 2020. |
Adjustments will need to be made to traditional “Libor plus” pricing. The data will become better as SOFR ages and the market finds the best way to extend the concept of an overnight rate into a term rate. The large money center banks have teams of people who are financial engineering the new benchmark to ensure the billions of dollars of loans and the trillions of dollars of derivatives get re-papered and reset advantageously. Community banks that can’t afford the resources are going to be dependent on minimally available analysis and anecdotal information.
We are in an extraordinary time. World War II, September 11, and the Great Depression did not have the instantaneous impact to both credit and rates that we are seeing today. While history might give us some whispers of guidance, it is more important for banks to remember that loan pricing is based on risk relative to “something.” If that something is not what it’s been in the past, then the reference and spread rates may not be valid. Competitive pressure in a bank’s footprint or the influence of money-center or super-regional banks may dictate loan pricing in a specific area.
Bankers need to have some perspective on how comfortable they will be when taking on loans priced in this market. In other words, the traditional view of credit spreads and rate modeling through ALCO and ALM methodologies are most likely are out of date. Credit pricing today must look at how newly underwritten loans will fare in a well-designed stress test and whether a bank is compensated rate-wise for the inherent risk, not just at the loan’s inception but over the forecast horizon.
For those CEOs that can’t sleep, benchmarks are yet another thing to keep you awake.

banking, Capital Plan for Community Banks, Community Banks Capital Plan, capital planning, liquidity, stress testing, Trade War Recession, Capital Requirements for community banks, community bank regulations, Global Oil Shock, Stagflation, Banking CRE, Banking Construction, Concentration Limits, CRE Banking Strategies
Author: Patti Casaleggio, Invictus Analytics
As regulatory scrutiny and expectations around commercial real estate (CRE) continue to evolve, staying ahead of supervisory trends has never been more critical for community and...

banking, Capital Plan for Community Banks, Community Banks Capital Plan, capital planning, liquidity, stress testing, Trade War Recession, Capital Requirements for community banks, community bank regulations, Global Oil Shock, Stagflation
Author: Adam Mustafa CEO, Invictus Analytics
What happens when inflation reaccelerates from already elevated levels while economic growth slows?
This is the defining challenge behind Invictus Analytics’ latest Oil Price Shock...

banking, Capital Plan for Community Banks, Community Banks Capital Plan, capital planning, liquidity, stress testing, Trade War Recession, Capital Requirements for community banks, community bank regulations, cblr
Author: Adam Mustafa, CEO, Invictus Analytics
Federal banking agencies recently finalized a rule lowering the Community Bank Leverage Ratio (CBLR) threshold from 9% to 8%, effective July 1, 2026. At first glance, the change...