Author: Patti Casaleggio, Invictus Analytics
As regulatory scrutiny and expectations around commercial real estate (CRE) continue to evolve, staying ahead of supervisory trends has never been more critical for community and...

Author: Avik Ray , Director, Liquidity Risk Analytics
In the dynamic landscape of community banking, staying ahead of potential liquidity problems is crucial for maintaining stability and growth. As guardians of the financial health of your institution, ensuring the safety and soundness of your bank requires understanding the importance of robust risk management strategies tailored to the unique characteristics of community banks. At the Invictus Group, we have produced some new analysis to identify potential liquidity issues in community banks across the United States.
Our analysis is a comprehensive examination of banks with assets ranging from 1 to 10 billion US dollars. We use a scatterplot to visualize the relationship between loan-to-deposit ratios against the leverage ratio adjusted for AOCI (Accumulated Other Comprehensive Income) losses. The size of each data point corresponds to the bank's assets, while a color scale highlights the proportion of brokered deposits to total deposits.
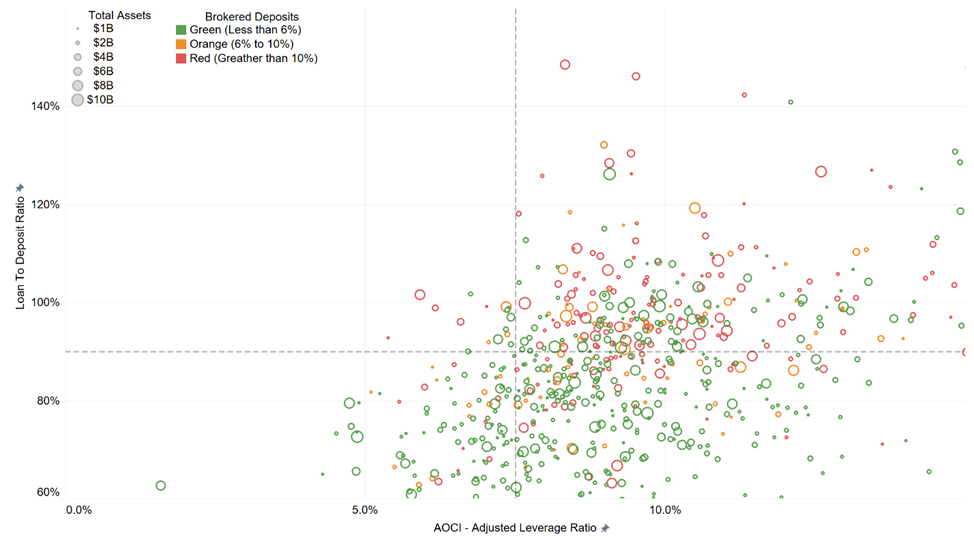
At first glance, this scatterplot may seem like an array of dots, but within it lies a wealth of strategic insights for community banks and those analyzing the sector.
Brokered deposits, depicted through the color scale, serve as a critical indicator of a bank's liquidity health. High levels of brokered deposits suggest a reliance on more volatile funding sources, which can amplify liquidity risks during market fluctuations. Unlike core deposits, which stem from customer relationships and tend to be stable, brokered deposits are more susceptible to sudden withdrawals, potentially leaving a bank exposed during times of stress. Therefore, a high proportion of brokered deposits signifies vulnerability to liquidity pressures, warranting proactive risk management measures.
Moreover, our analysis adjusts leverage ratios for AOCI losses, shedding light on another dimension of potential risk. AOCI encompasses unrealized gains and losses on certain financial instruments, reflecting fluctuations in the market value of assets such as available-for-sale securities. In a rising rate environment, banks that purchased securities when rates were lower have found themselves accumulating unrealized losses. If these losses were to be realized, they would erode a bank's capital base, impairing its ability to absorb losses and meet regulatory requirements. Thus, banks grappling with significant AOCI losses may face heightened liquidity pressures, as diminished capital buffers limit their capacity to weather adverse conditions.
By looking at the implications of brokered deposits and AOCI losses in unison within the context of our scatterplot analysis, we can pinpoint institutions that may be facing upcoming liquidity issues.
Banks positioned in the lower left region of the scatterplot may have used their capital for securities purchases rather than making loans and if they have a high reliance on brokered deposits should be proactively pursuing risk mitigation strategies, such as diversifying funding sources, optimizing asset-liability management practices, and fortifying capital reserves.
In conclusion, our analysis offers a unique perspective on community bank liquidity, providing risk management professionals to understand potential issues that could result in more serious problems . By having these insights, community banks can take steps to bolster their resilience, safeguard depositor interests, and sustainably thrive in a competitive landscape.
If you would like to see where your institution sits in the liquidity scatterplot, please reach out to liquidity@invictusgrp.com
Schedule a consultative discussion


banking, Capital Plan for Community Banks, Community Banks Capital Plan, capital planning, liquidity, stress testing, Trade War Recession, Capital Requirements for community banks, community bank regulations, Global Oil Shock, Stagflation, Banking CRE, Banking Construction, Concentration Limits, CRE Banking Strategies
Author: Patti Casaleggio, Invictus Analytics
As regulatory scrutiny and expectations around commercial real estate (CRE) continue to evolve, staying ahead of supervisory trends has never been more critical for community and...

banking, Capital Plan for Community Banks, Community Banks Capital Plan, capital planning, liquidity, stress testing, Trade War Recession, Capital Requirements for community banks, community bank regulations, Global Oil Shock, Stagflation
Author: Adam Mustafa CEO, Invictus Analytics
What happens when inflation reaccelerates from already elevated levels while economic growth slows?
This is the defining challenge behind Invictus Analytics’ latest Oil Price Shock...

banking, Capital Plan for Community Banks, Community Banks Capital Plan, capital planning, liquidity, stress testing, Trade War Recession, Capital Requirements for community banks, community bank regulations, cblr
Author: Adam Mustafa, CEO, Invictus Analytics
Federal banking agencies recently finalized a rule lowering the Community Bank Leverage Ratio (CBLR) threshold from 9% to 8%, effective July 1, 2026. At first glance, the change...