Why Jill Cetina’s latest presentation is a must-read for bankers
Amid rising economic uncertainty and market volatility, Jill Cetina—banking expert, economist, and faculty member of the Certificate of Bank Treasury Risk...
How to use Portfolio Weather Event Risk analytics to evaluate potential flood risks for community banks
Extreme weather events are happening more often in the United States. And that should be of concern to community banks.
When extreme weather hits, community banks are at risk more often than the largest banks, especially when it comes to floods, the New York State Department of Financial Services warned banks in a 2020 letter about climate change.
(Take note: The Comptroller of the Currency just announced its new climate risk officer—Dr. Yue (Nina) Chen. She was previously Executive Deputy Superintendent of the Climate Division at the New York State Department of Financial Services, which issued that warning.)
Over a five-week period this summer, five extreme rain events occurred in the U.S., from California to Texas to the Mid-West: on July 26 in St. Louis, on July 27 in Eastern Kentucky, on Aug. 1 in Eastern Illinois, on Aug. 5 in Death Valley, Calif., and on Aug. 22 in Dallas.
While there is no easy solution to mitigating physical risks related to climate change, the Invictus Group has developed Portfolio Weather Event Risk (PoWER™) analytics to help community banks begin to understand and evaluate their exposure.
Let’s look at eastern Kentucky, which experienced its worst flooding in decades in July. More than 1,648 homes were destroyed and 39 people died, according to news reports. The National Weather Service said the peak rainfall totals of 14 to 16 inches “are historically unheard of,” with less than a 1 in 1,000 chance of that amount of precipitation occurring.
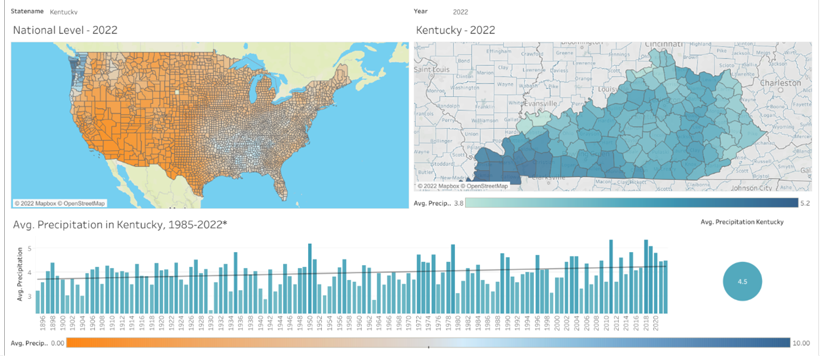
Rainfall in Kentucky (Source: PoWER™ analytics)
Scientists say that climate change is triggering more extreme weather events like these recent flooding events. And that means that bankers will need to understand climate-related risks and how they impact their local communities and lending activities.
If community banks think that the federal flood insurance program has their portfolio protected, they need to think again. As New York state pointed out in its industry letter, at least one estimate concluded that 80 percent of commercial properties damaged in recent hurricanes were outside official FEMA flood zone maps, which means they weren’t required to have adequate flood protection. And many of those maps are outdated.
The Invictus system supplements the FEMA maps with precipitation and temperature data from NASA and NOAA, as well as detailed information on wildfires, and EPA carbon emissions data. It then overlays a bank’s actual lending footprint on the climate data, allowing the executive team and board to see a visualization of their physical risks.
If we look at an example of a $500-million-bank based in Kentucky, with loans distributed across the state, we can quantify the exposure of loans to different forms of different natural hazards in terms of their historical impact.
While the limited availability of data does not allow us to predict with sufficient accuracy the probability of future extreme weather events, this exercise is a practical first step for community banks.
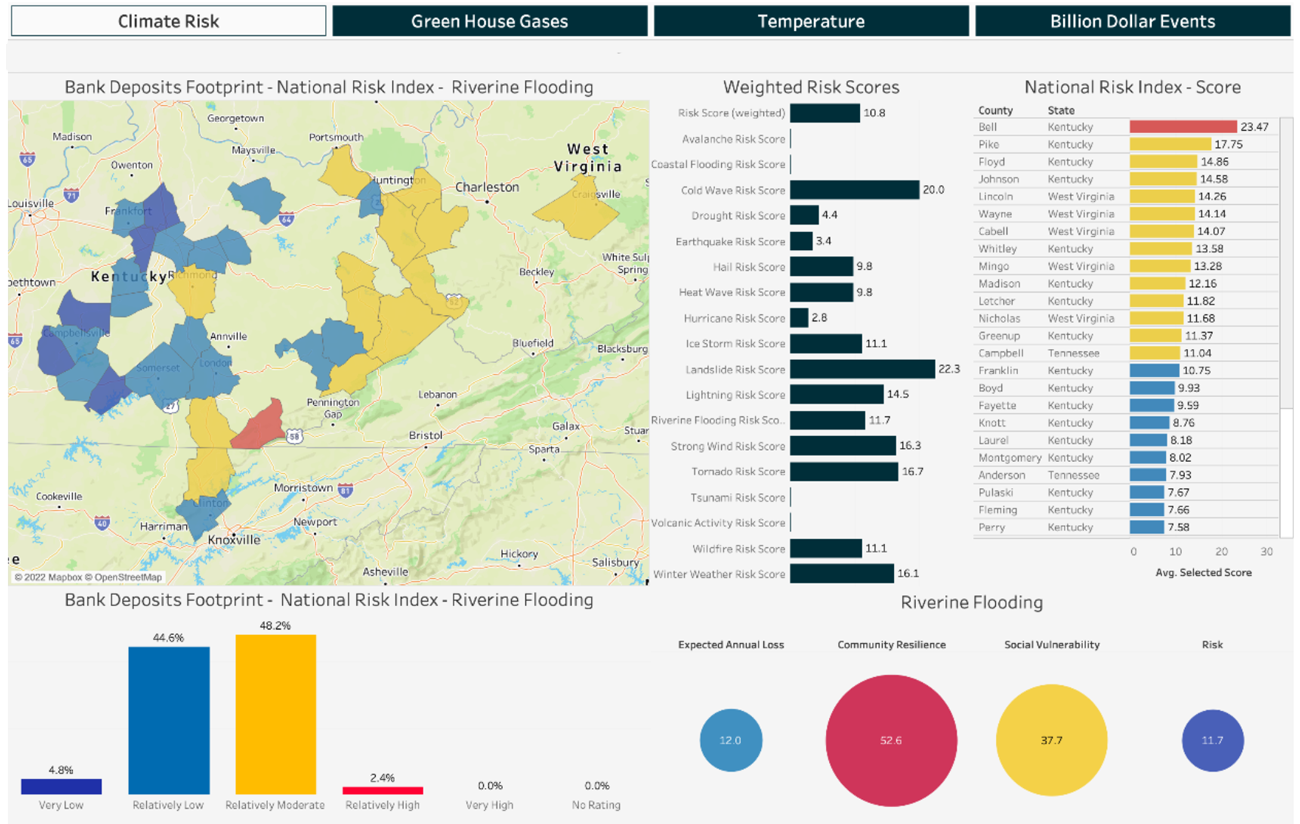
The results show that loans made in the eastern part of the region are more exposed to riverine flooding risk. While this information may not be news to those that operate lending operations in the area, its implications for other climate-related risks that may be more enlightening. Scientists have concluded that rainfall is the most important physical process for triggering landslides.
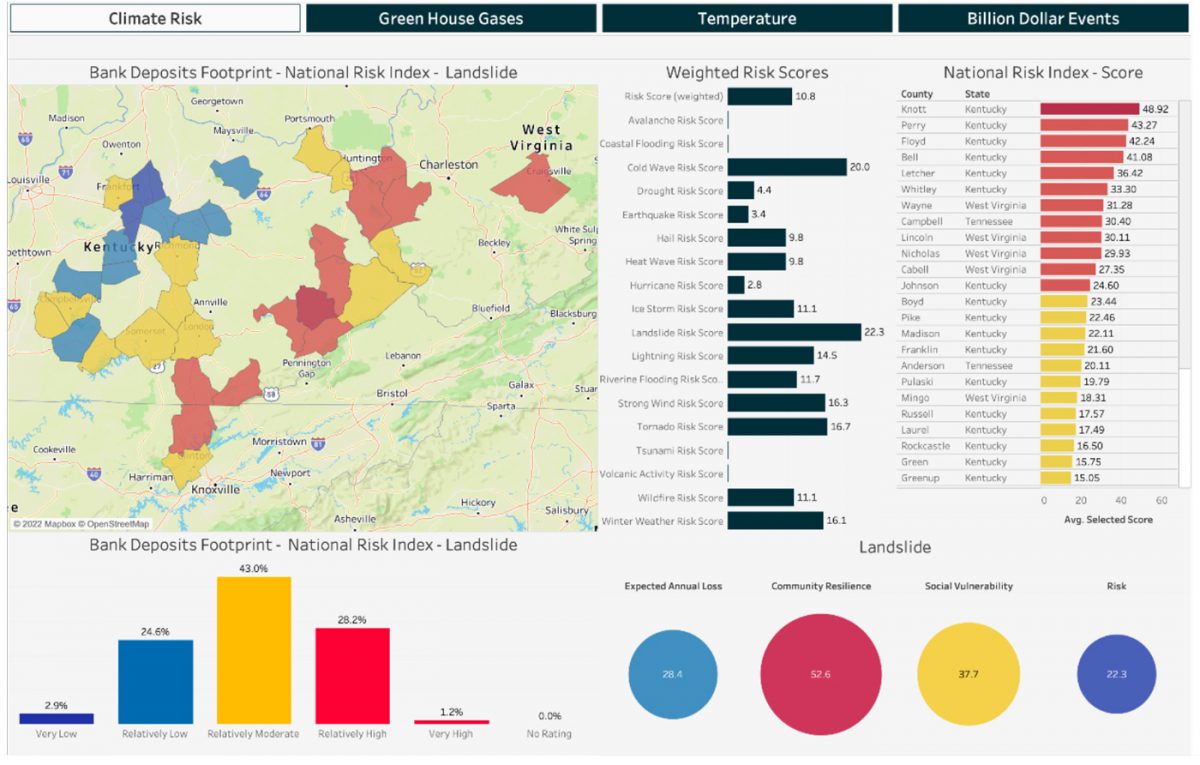
So now, we can look at the same bank’s exposure to landslide risks, a factor the banks had undoubtedly not priced into its future lending risks.
As Acting OCC Comptroller Michael Hsu said in a September speech, “with climate-related risks, I believe we are much more exposed to failures of imagination—not asking enough “what if?” questions—than we are to failures of stringency or consistency.”
Here’s what the PoWER™ analytics show for that same bank, except now we are looking at its risk for landslides. Where 2.4 percent of the Kentucky bank’s loan portfolio was in a relatively high-risk category for losses due to floods, 29.4 percent of the portfolio is at a higher risk for losses if there are landslides.
Extreme weather events are becoming more common around the world. Unprecedented storms may, in fact, become the norm in the years to come. Using loan-level data, the Portfolio Weather Event Risk Analysis (PoWER)™ maps specific climate risks to geographic markets and displays them visually, allowing the C-Suite, boards, shareholders, and regulators to see the potential impact on an individual bank.
While the regulatory focus right now is on developing climate risk analytics for the largest banks, regulators say they will next turn to community banks, as this white paper discussed. “The physical and transition risks associated with climate change pose safety and soundness challenges for banks,” Comptroller Hsu said in September. “There is an urgent need for action.”
Invictus PoWER™ analytics combine a bank’s unique lending information with climate data to visualize the loan portfolio’s exposure to 18 types of natural hazards and weather-related risks, which are all increasing due to climate change. The tool is accessible via a portal, and visualizations can be downloaded for management, board and regulatory presentations.
To learn more about PoWER™ and the Invictus Group climate analytical division, please contact climaterisk@invictusgrp.com.

Most Read, CEOs & Boards, banking, Capital Plan for Community Banks, Community Banks Capital Plan, capital planning, stress testing, cre
Why Jill Cetina’s latest presentation is a must-read for bankers
Amid rising economic uncertainty and market volatility, Jill Cetina—banking expert, economist, and faculty member of the Certificate of Bank Treasury Risk...